PHENOPIX PLOTS
Seasonal phenology is a key driver of several ecosystem-processes, and is of relevance for abiotic factors such as vegetation water uptake, soil cover and stabilization, as well as for biotic factors such as insect-host and flower-pollination interactions, or availability of fruits and leaves as fodder. Moreover, on medium time scales phenology is a key factor for species ranges. On longer time scale it has an evolutionary meaning affecting plant species fitness, since factors as frost exposure or reproduction success depends on an optimized timing of annual life-cycle events. Therefore, plant species in harsh mountain environments with short growing seasons rely on a close adaptation of phenological events to local conditions. In a climate change scenario is phenology a crucial phenomenon to observe. During the duration of this project we established an observation network on grassland ecosystems over South-Tyrol. An approach to observe vegetation phenology is based on the normalized difference vegetation index (NDVI).
The measurement stations are equipped NDVI sensors and with observation cameras. Stations have been acquiring data beginning from end 2014 until end of the year 2016. For analysing the acquired data we made use, adapted and further developed the R-package Phenopix. This is a tool containing a a collection of functions to process digital images, depict index trajectories and extract relevant phenological stages. With our work, we aimed at extracting phenological trajectories (vegetation temporal dynamics) from observation at multiple scales.
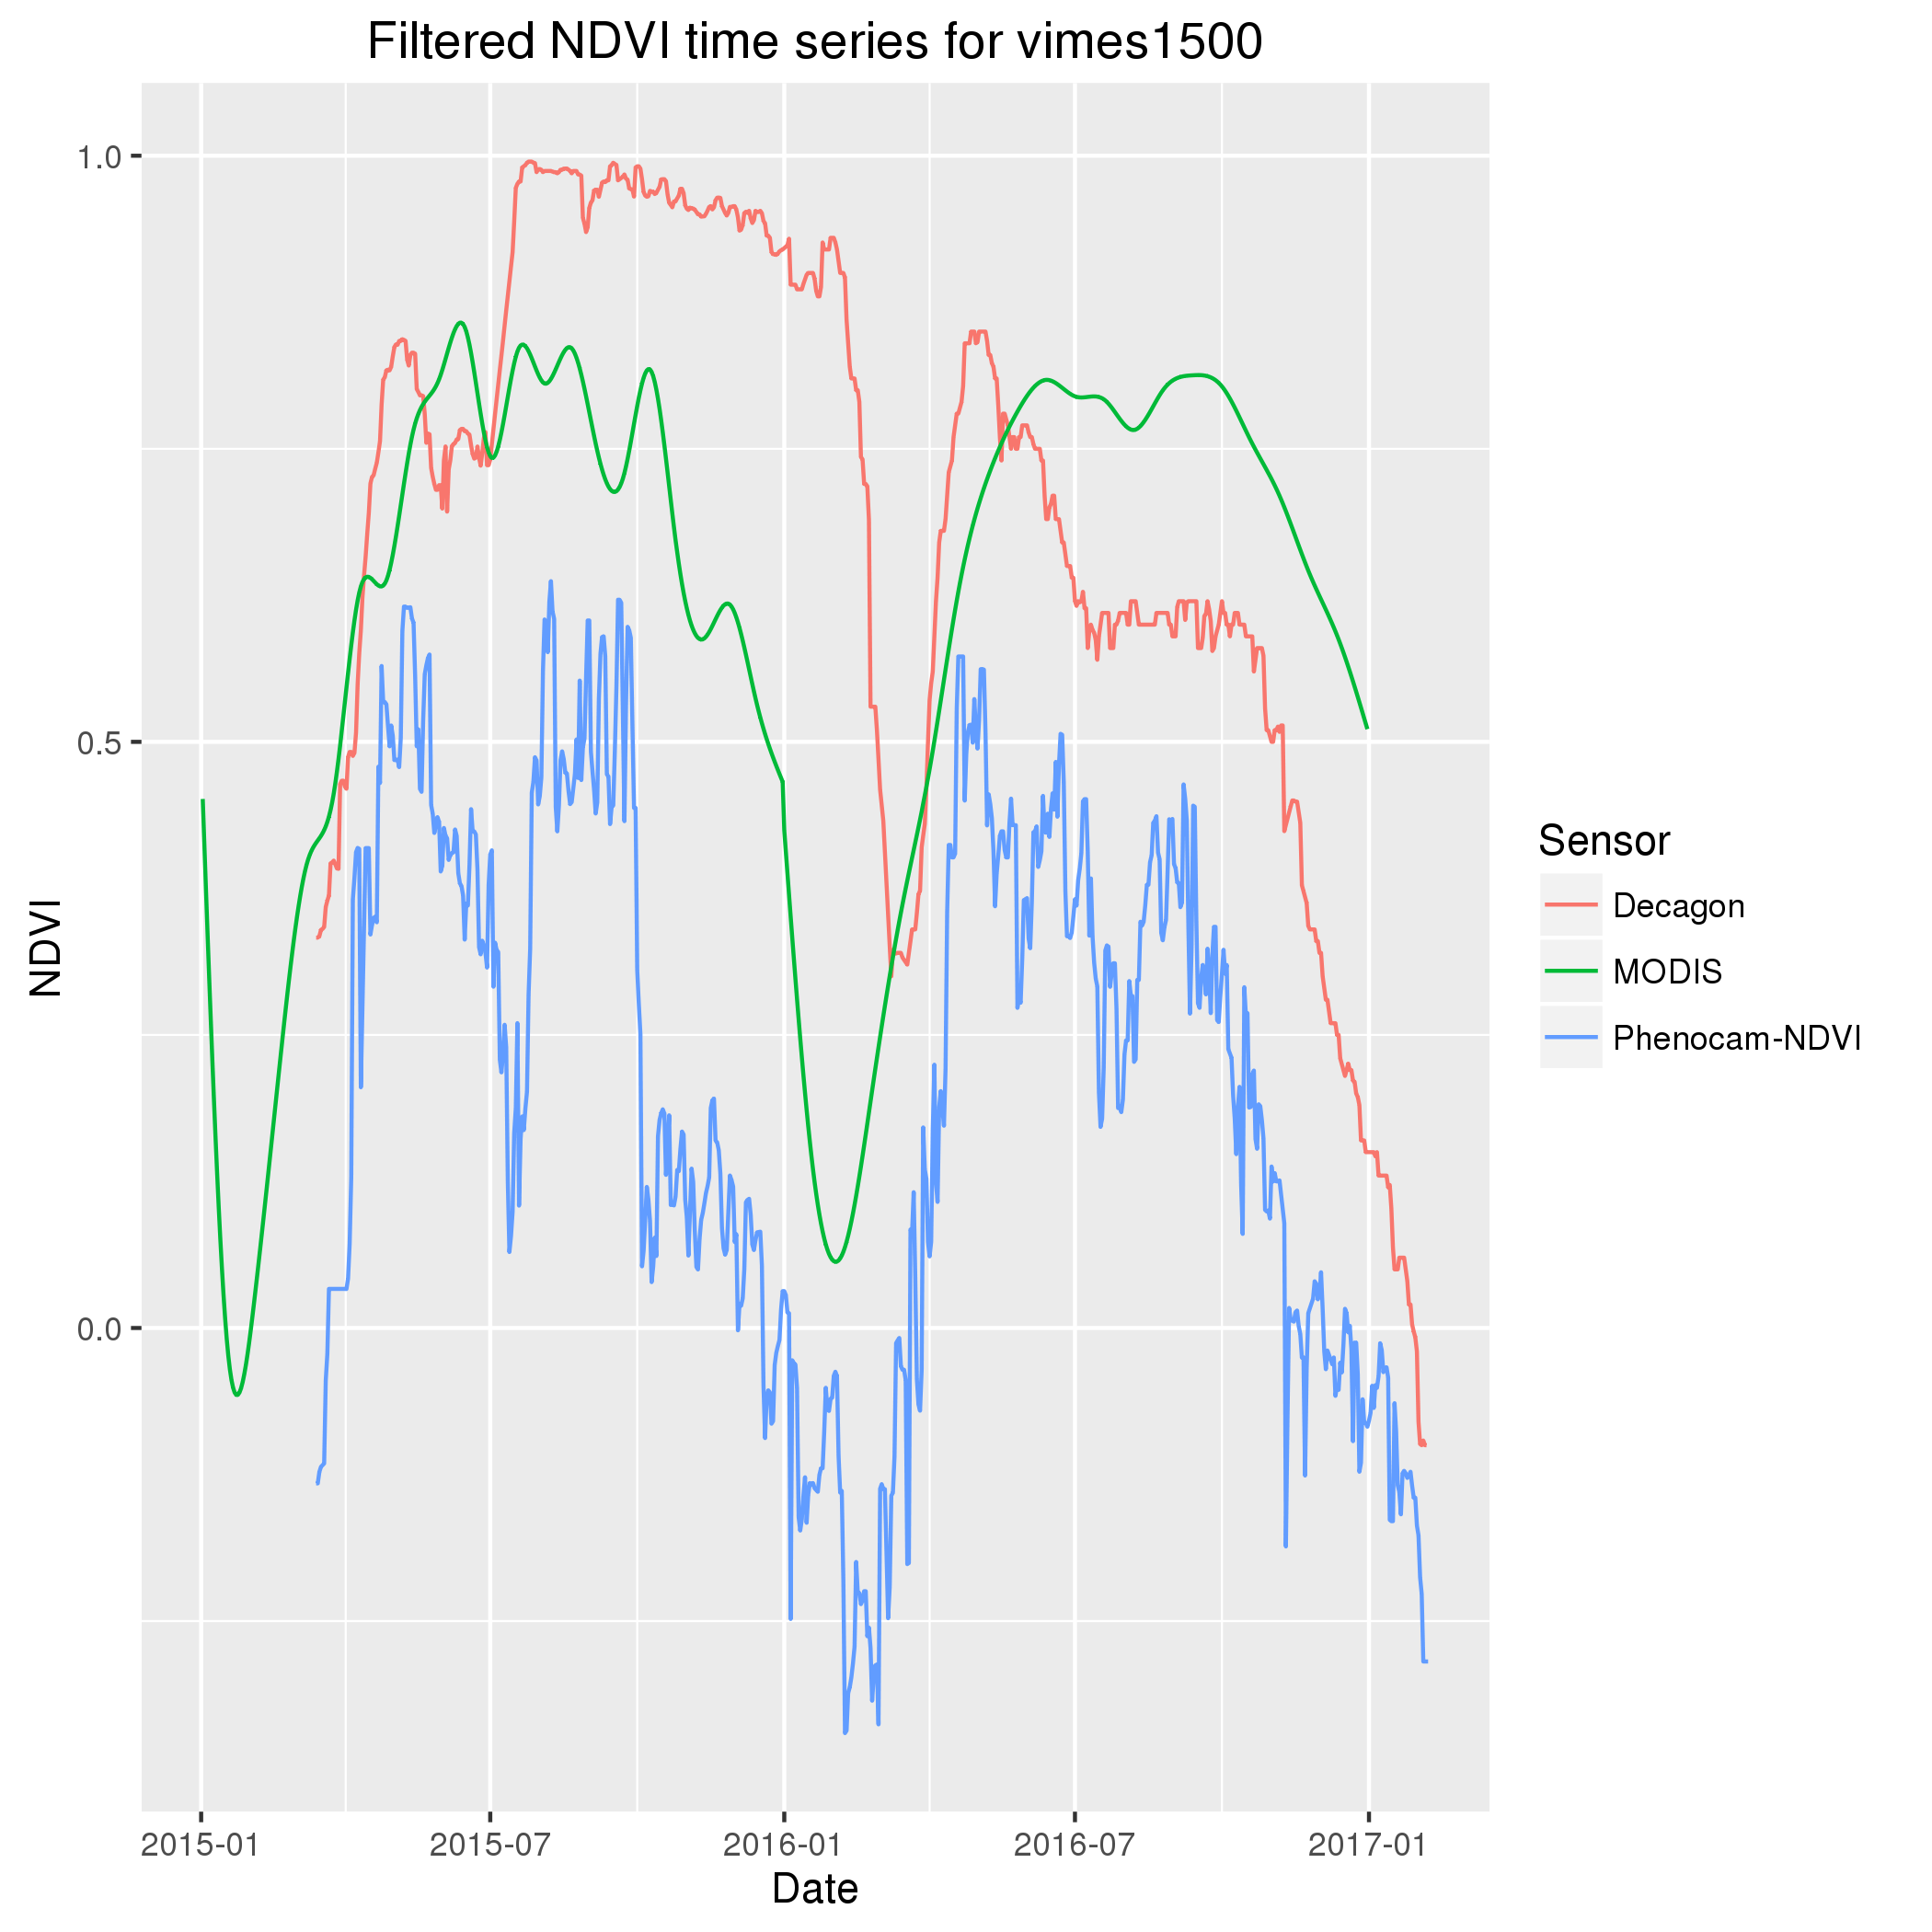
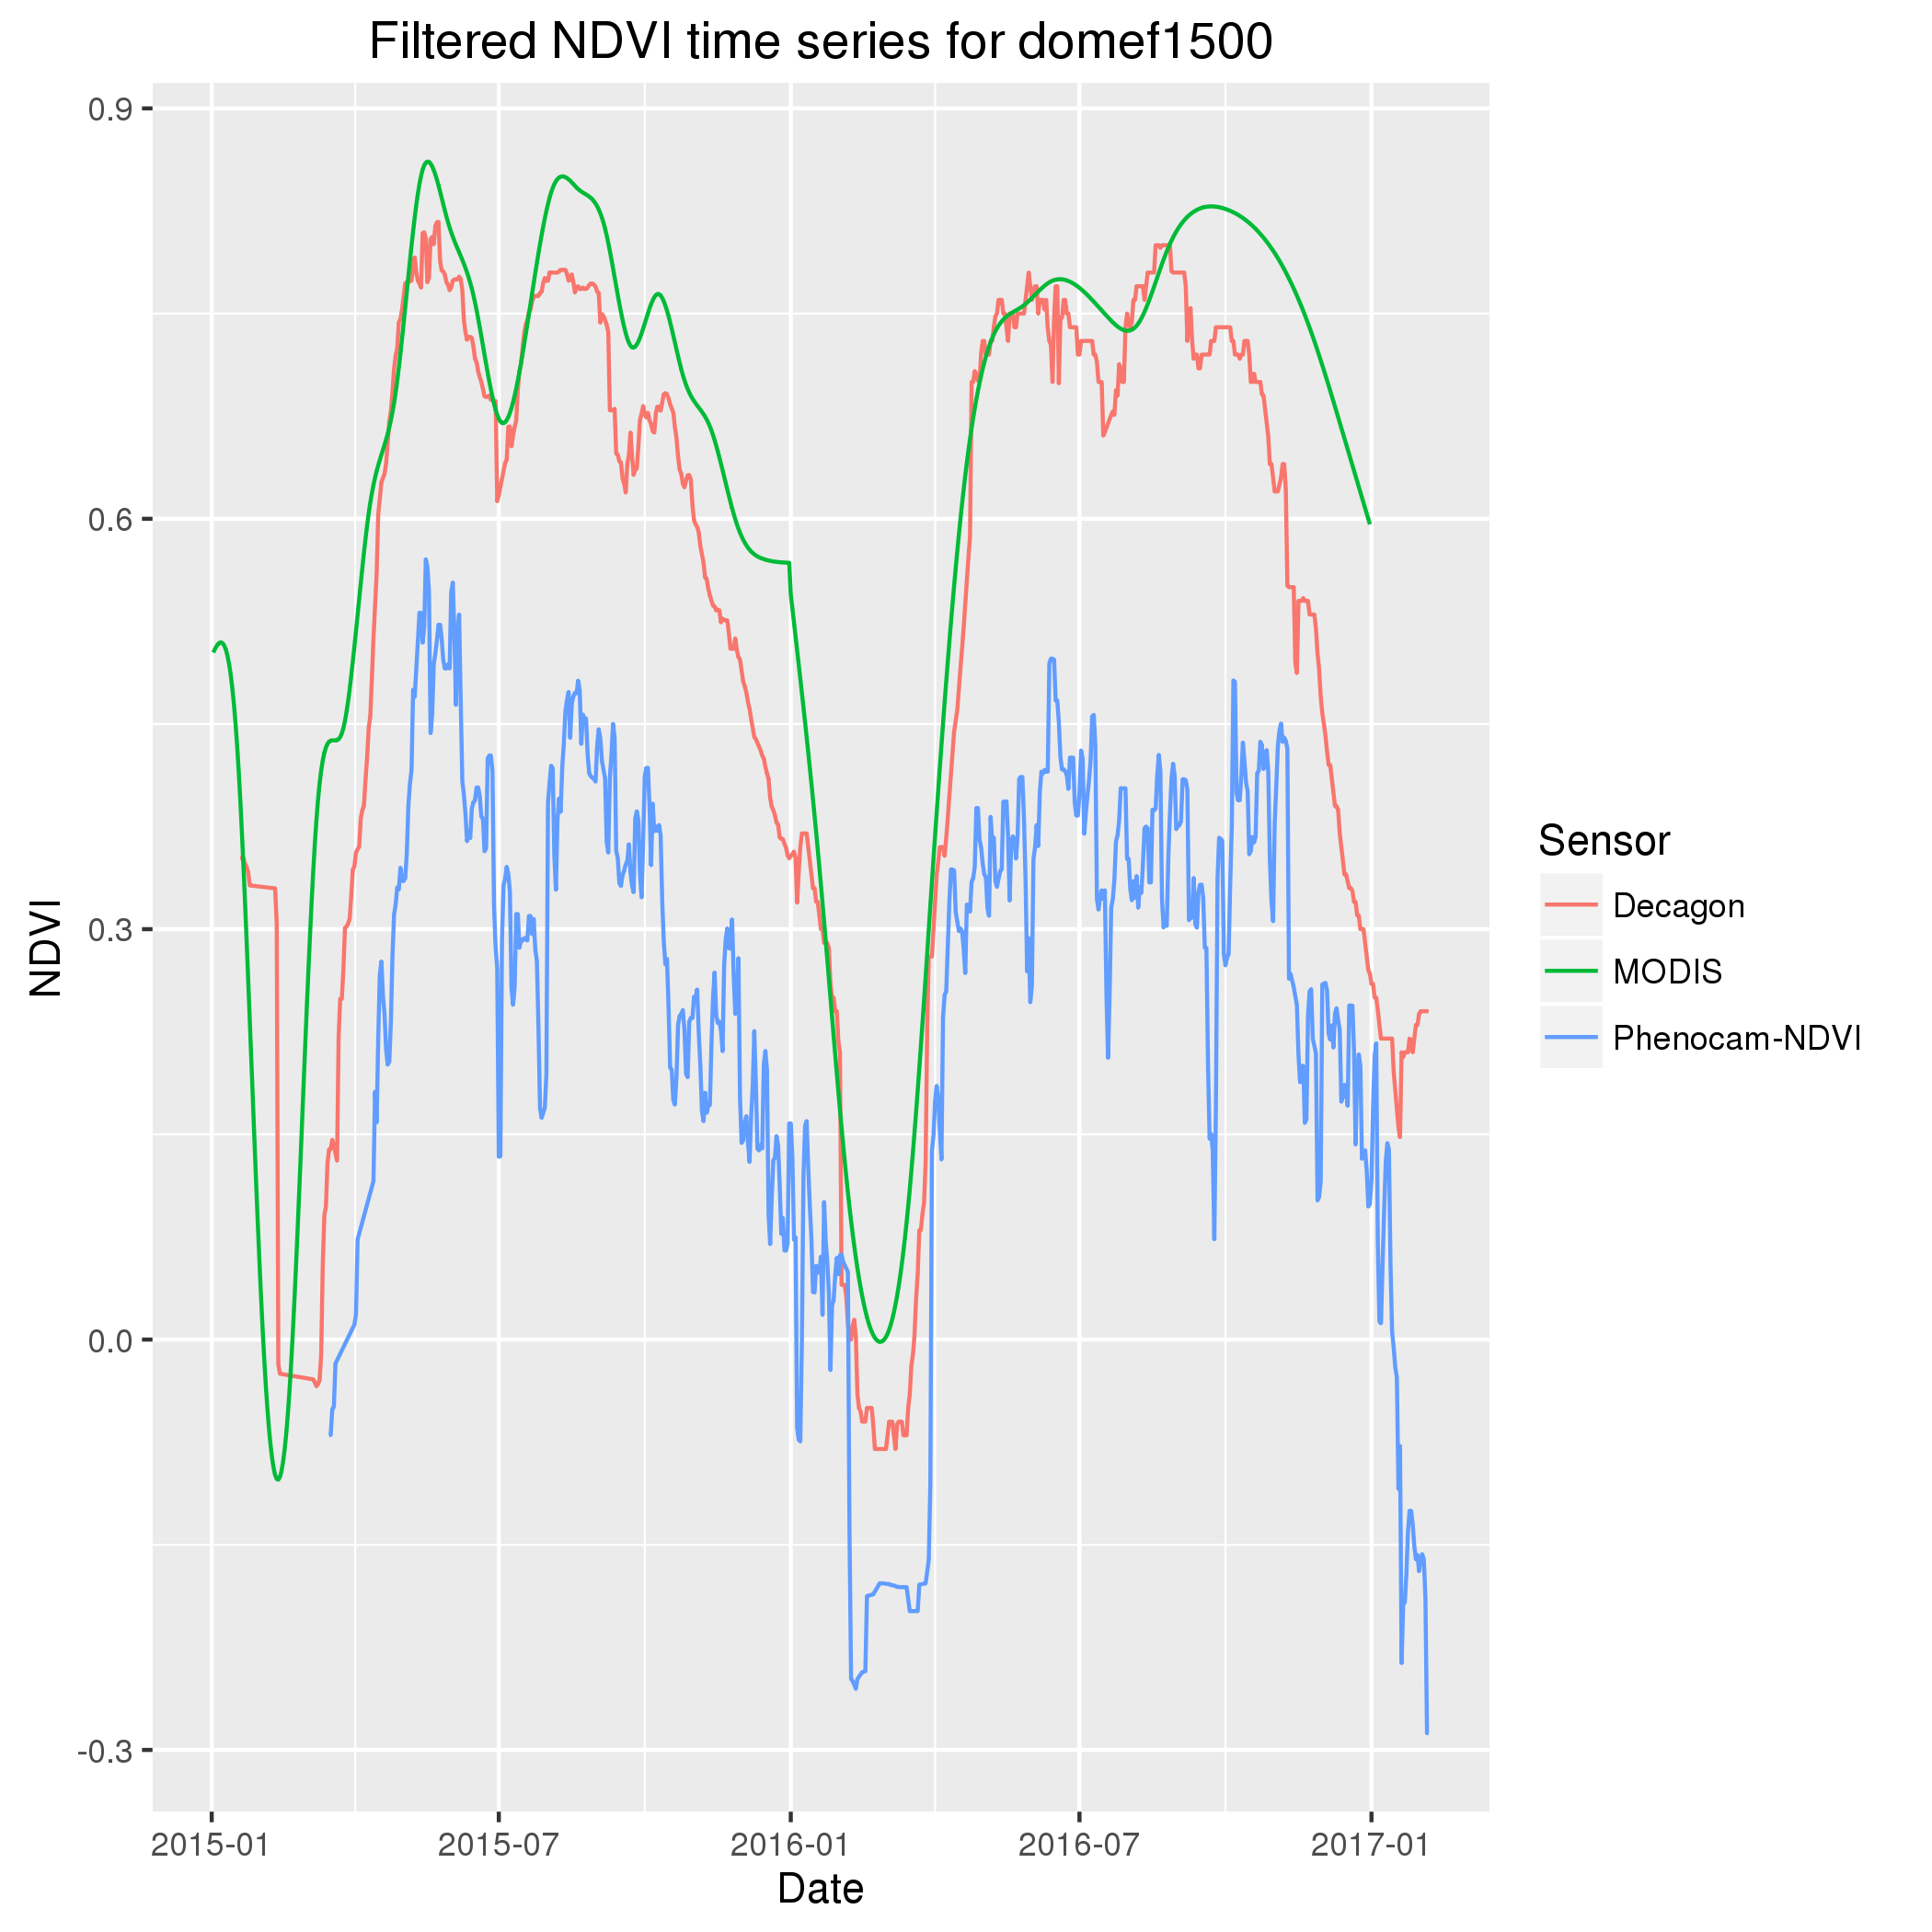
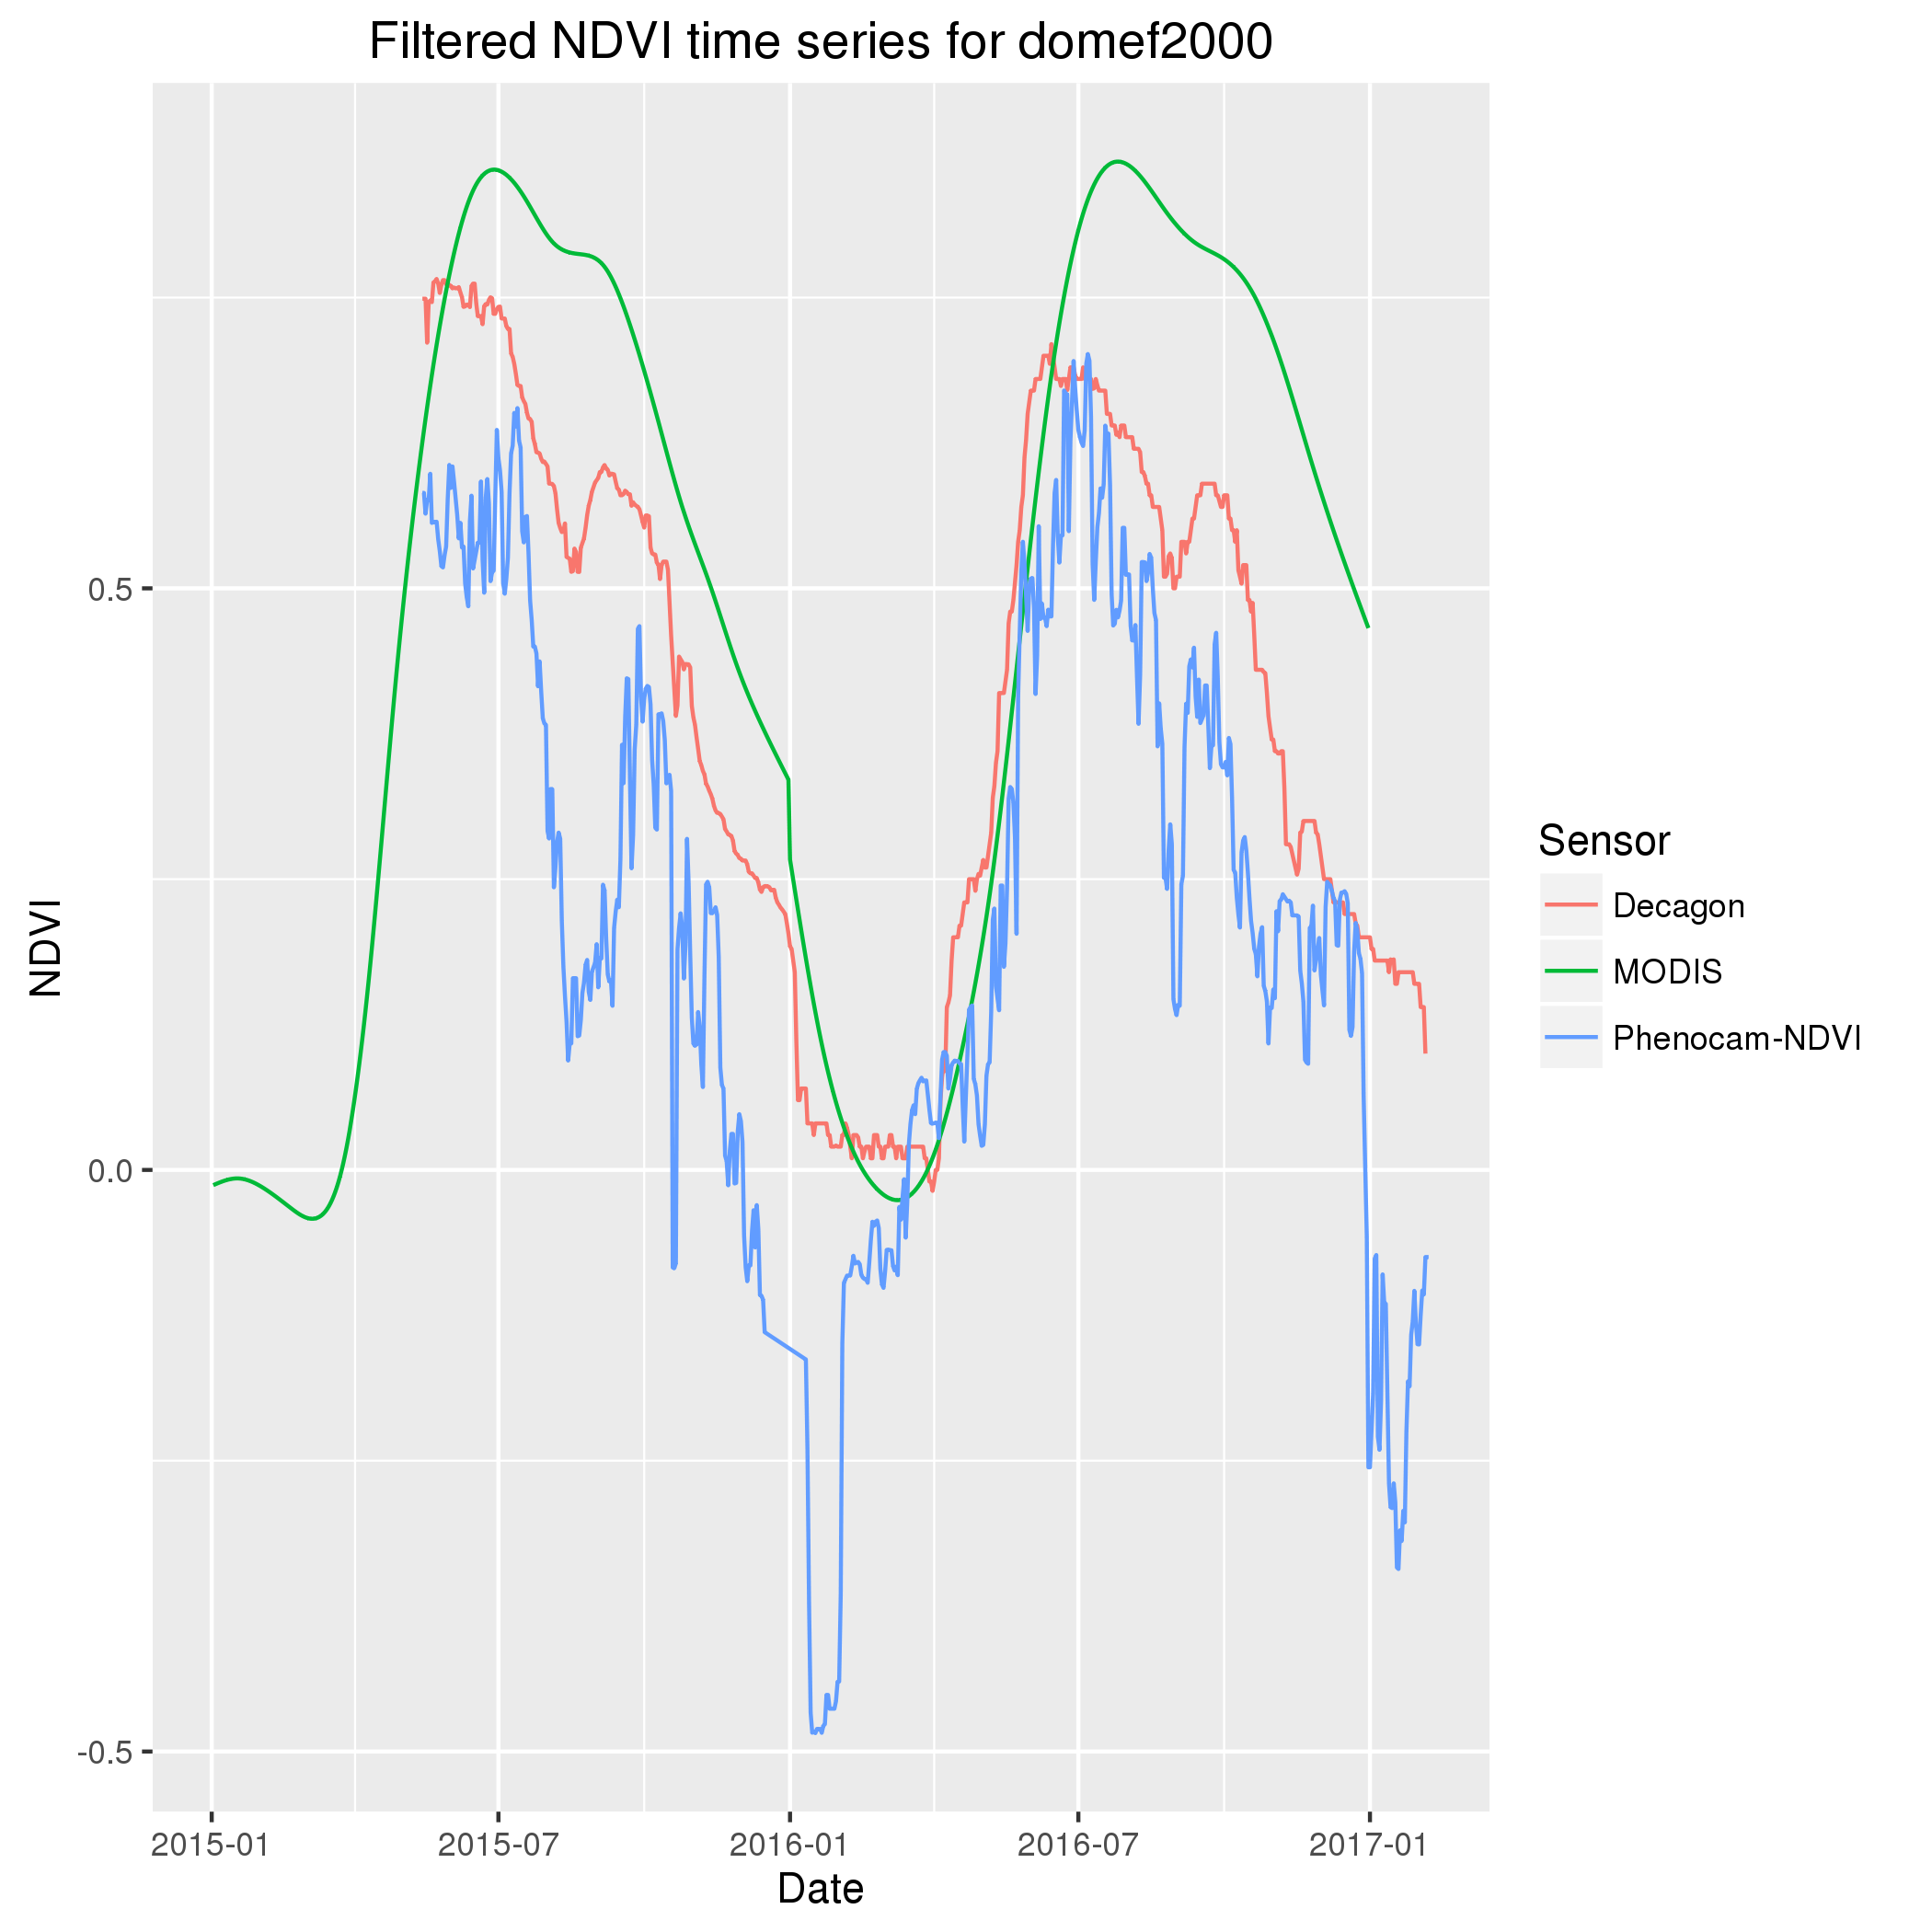
With the above mentioned R package we analysed with the same methods data from NDVI sensors, IR enabled observation cameras and NDVI subsets from MODIS collection 5. The plots in this page show time series from the different approaches.
Each of these methods has advantages and disadvantages. The advantage of NDVI sensors is the observation being restricted on a pure area of a specific ecosystem. On the other hand, this method doesn’t account for the spatial variability within the same ecosystem at landscape scale. The advantage of observation cameras is the availability of a spatially explicit observation at this specific scale. This method provides observation with different viewing angles, possibly introducing artefacts in the spatial variability of the observed process. As last, remote sensing offers the opportunity of remote observations over large areas. Cloudiness hampers these observations causing gaps in the time series. Comparing results from the different scales and sensors allowed us to understand the vegetation dynamics at multiple spatial scales.
For additional information contact: Jeroen Staab or Enrico Tomelleri.
If you are interested in additional information you can read the paper Phenopix: A R package for image-based vegetation phenology
The R package is available at http://r-forge.r-project.org/projects/phenopix/
It can be installed within R, using the following code:
install.packages("phenopix", repos="http://R-Forge.R-project.org")


